Understand Your SQL Instantly
Paste your stored procedures or views, or upload a file to get a detailed analysis — broken down section by section, with visual diagrams and a built-in AI chat.
Or Upload a File
How it works
Three steps from raw SQL to full understanding.
Paste or upload your SQL
Drop in a stored procedure, a view, or any ad-hoc query. Files up to 5 MB are supported.
AI breaks it down
Our analysis engine maps every section, parameter, join, and dependency into a structured result.
Explore the output
Click through the code breakdown, spin up the diagram views, or ask the AI follow-up questions.
Everything you need to understand complex SQL
From code breakdown to visual maps — all in one place.
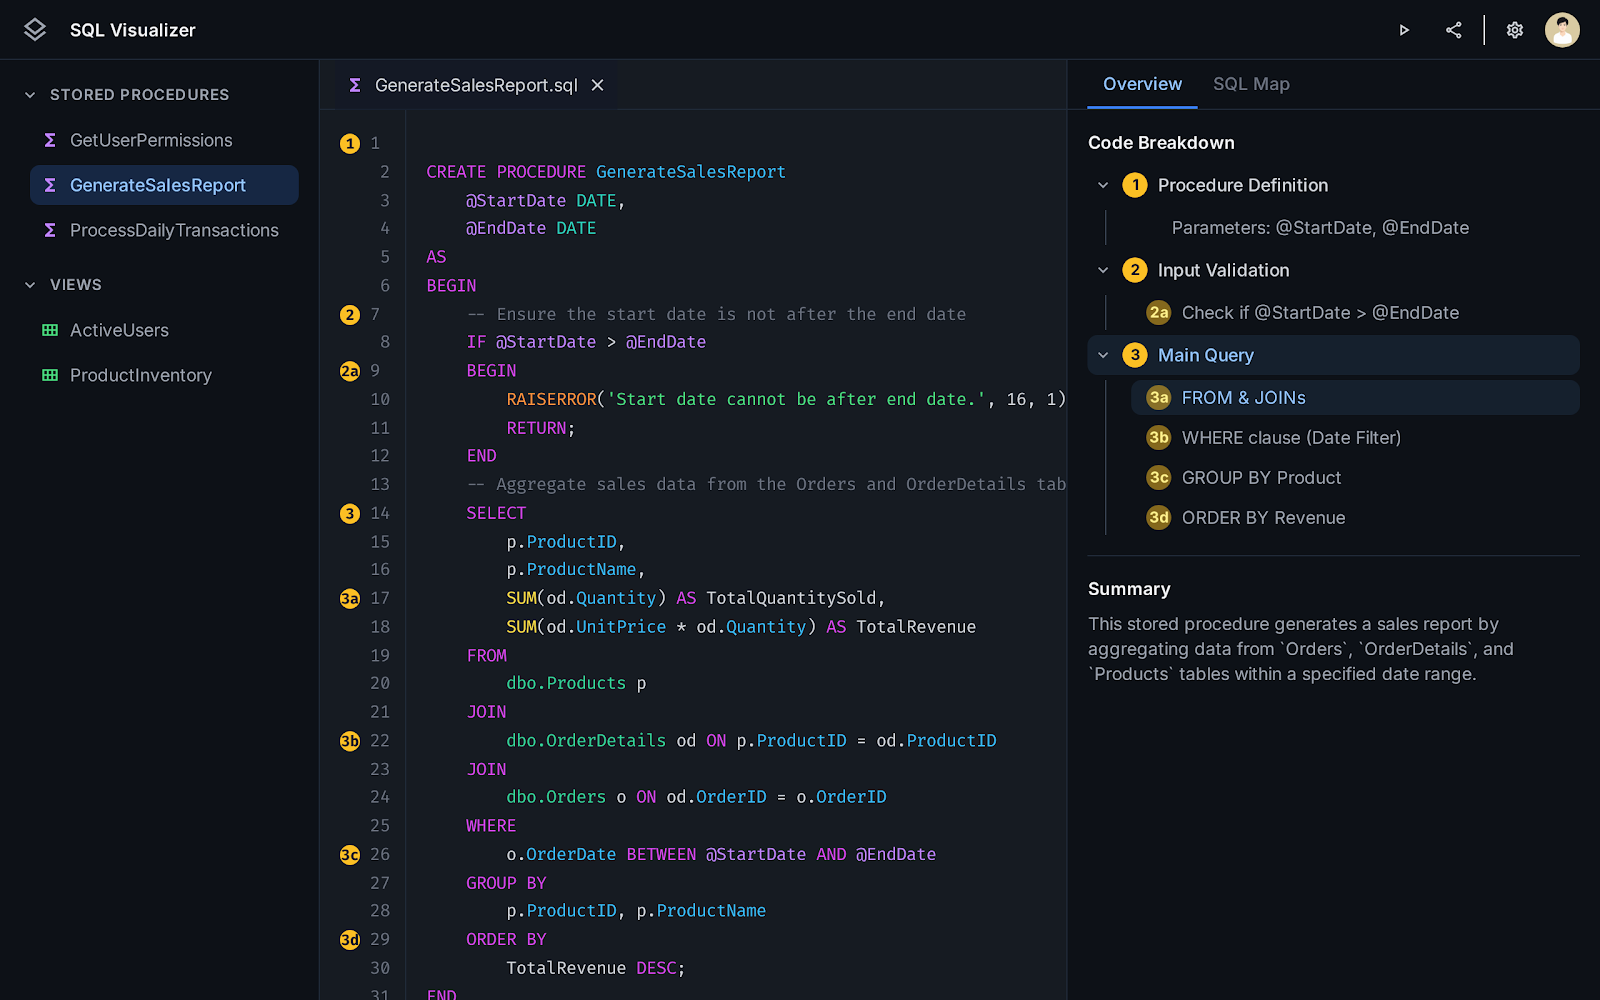
Instant SQL Breakdown
Paste any stored procedure, view, or query and get a structured breakdown of every section — what it does, which tables it touches, and why.
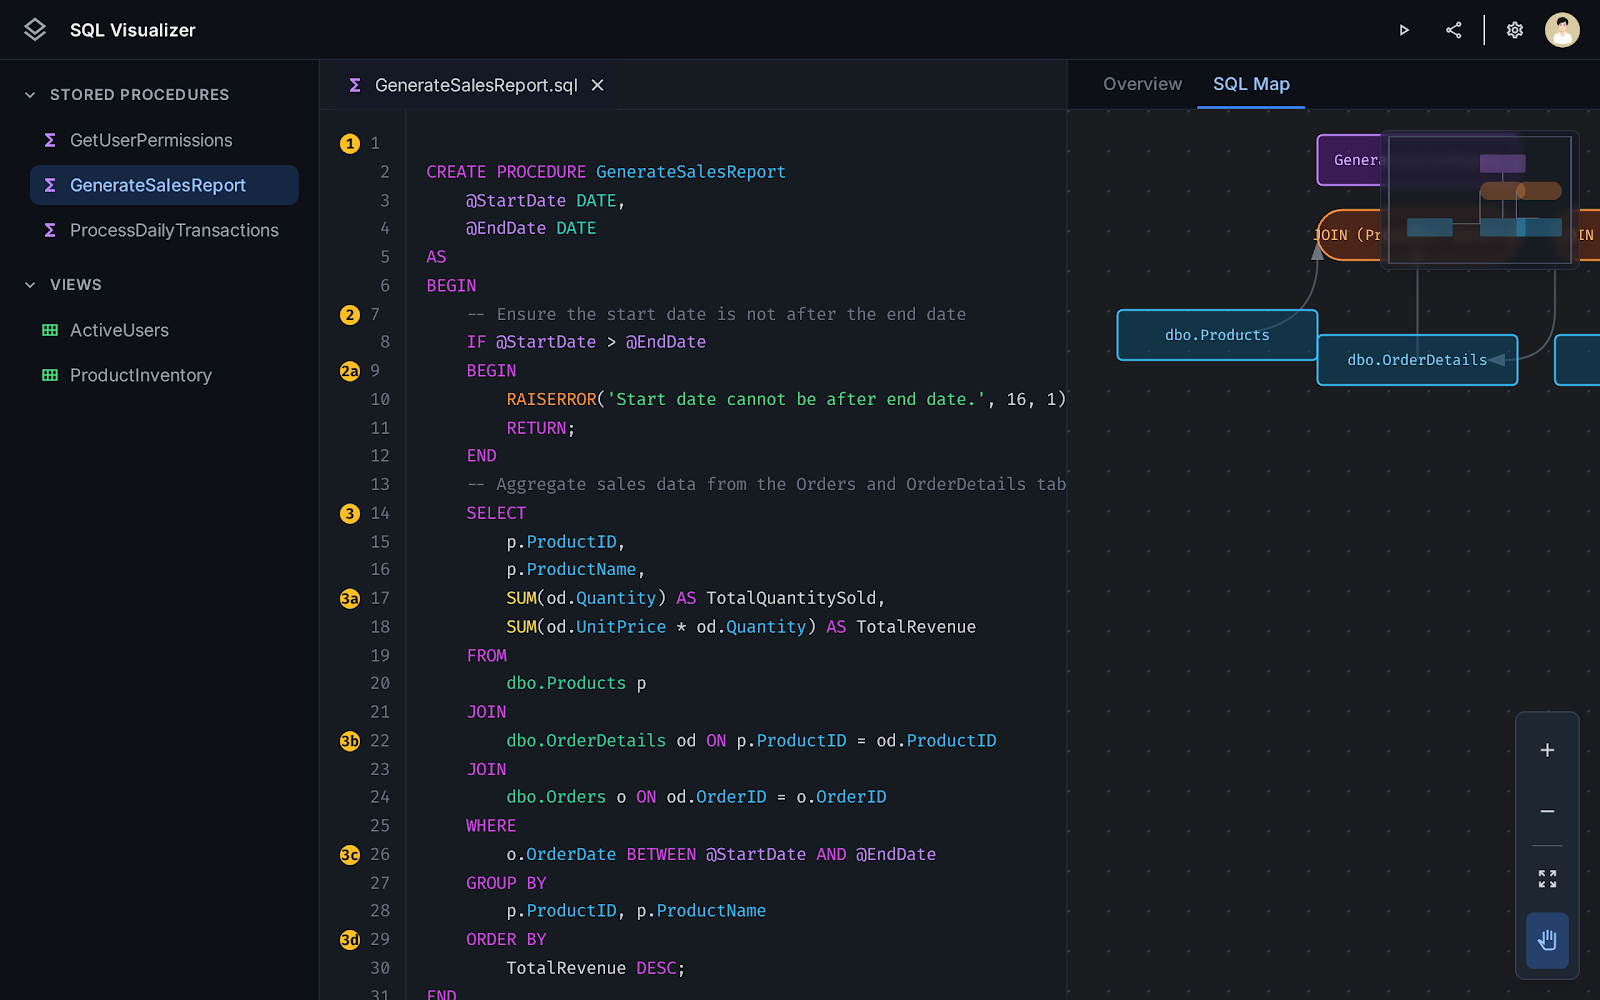
Visual Table Relationships
See how your tables connect. The SQL Map automatically generates a Mermaid diagram of all joins, foreign keys, and data flows in your query.
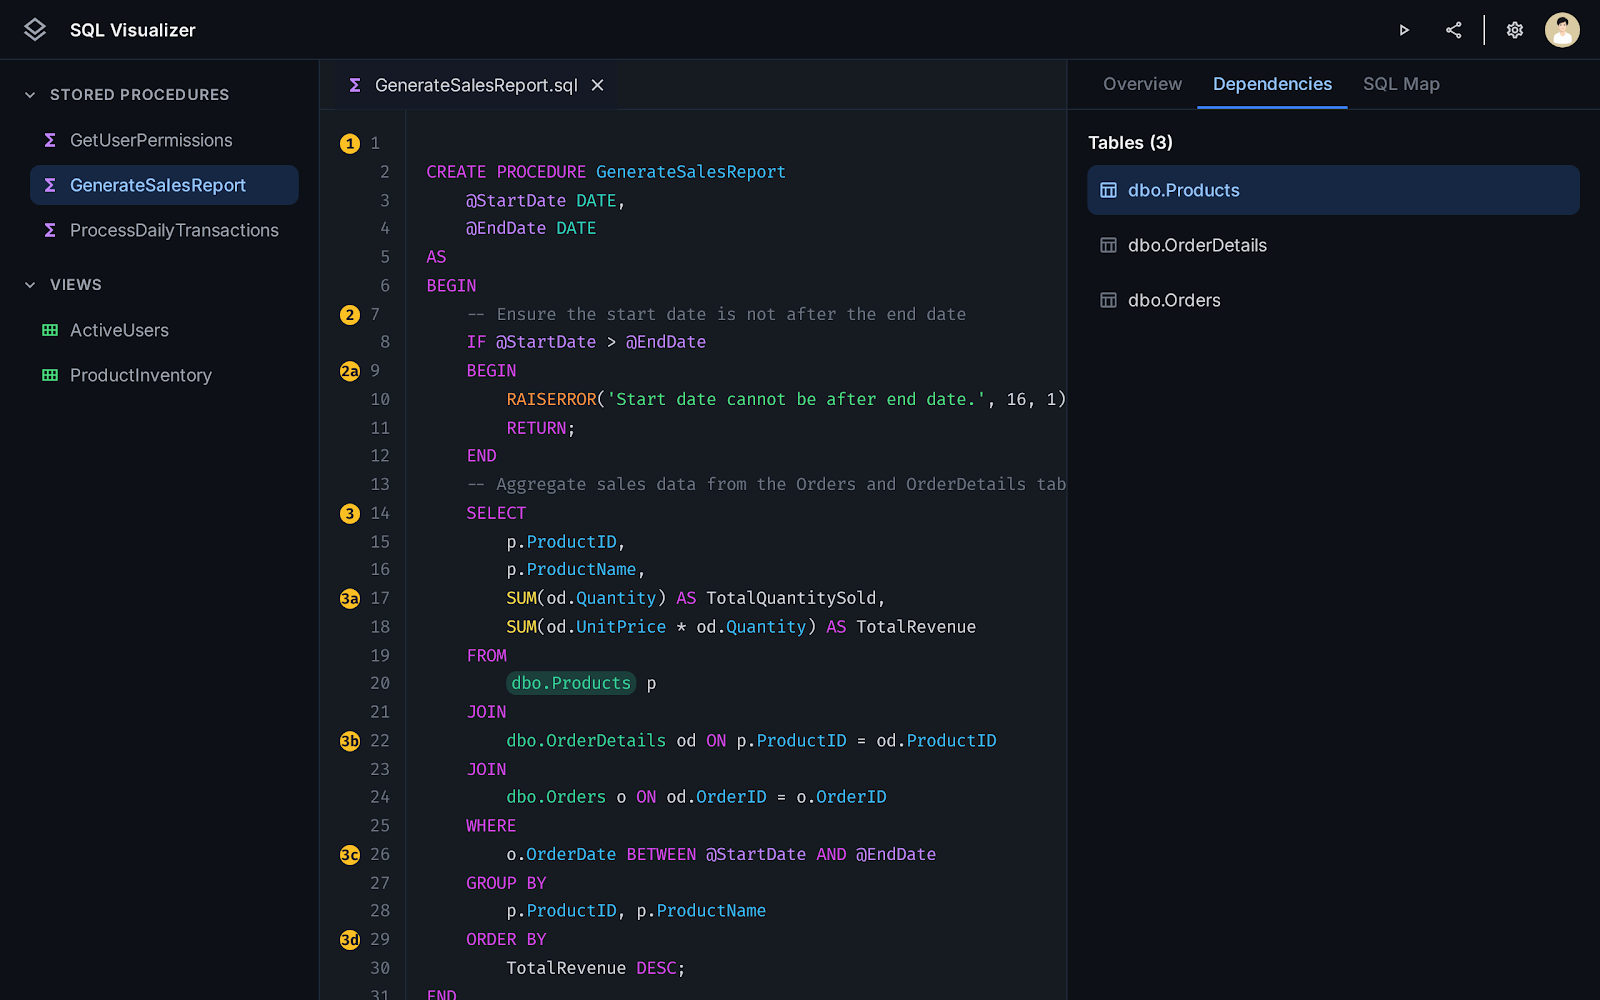
Dependency Graph
Understand upstream and downstream dependencies at a glance. Know exactly what each part of your query relies on before you change it.
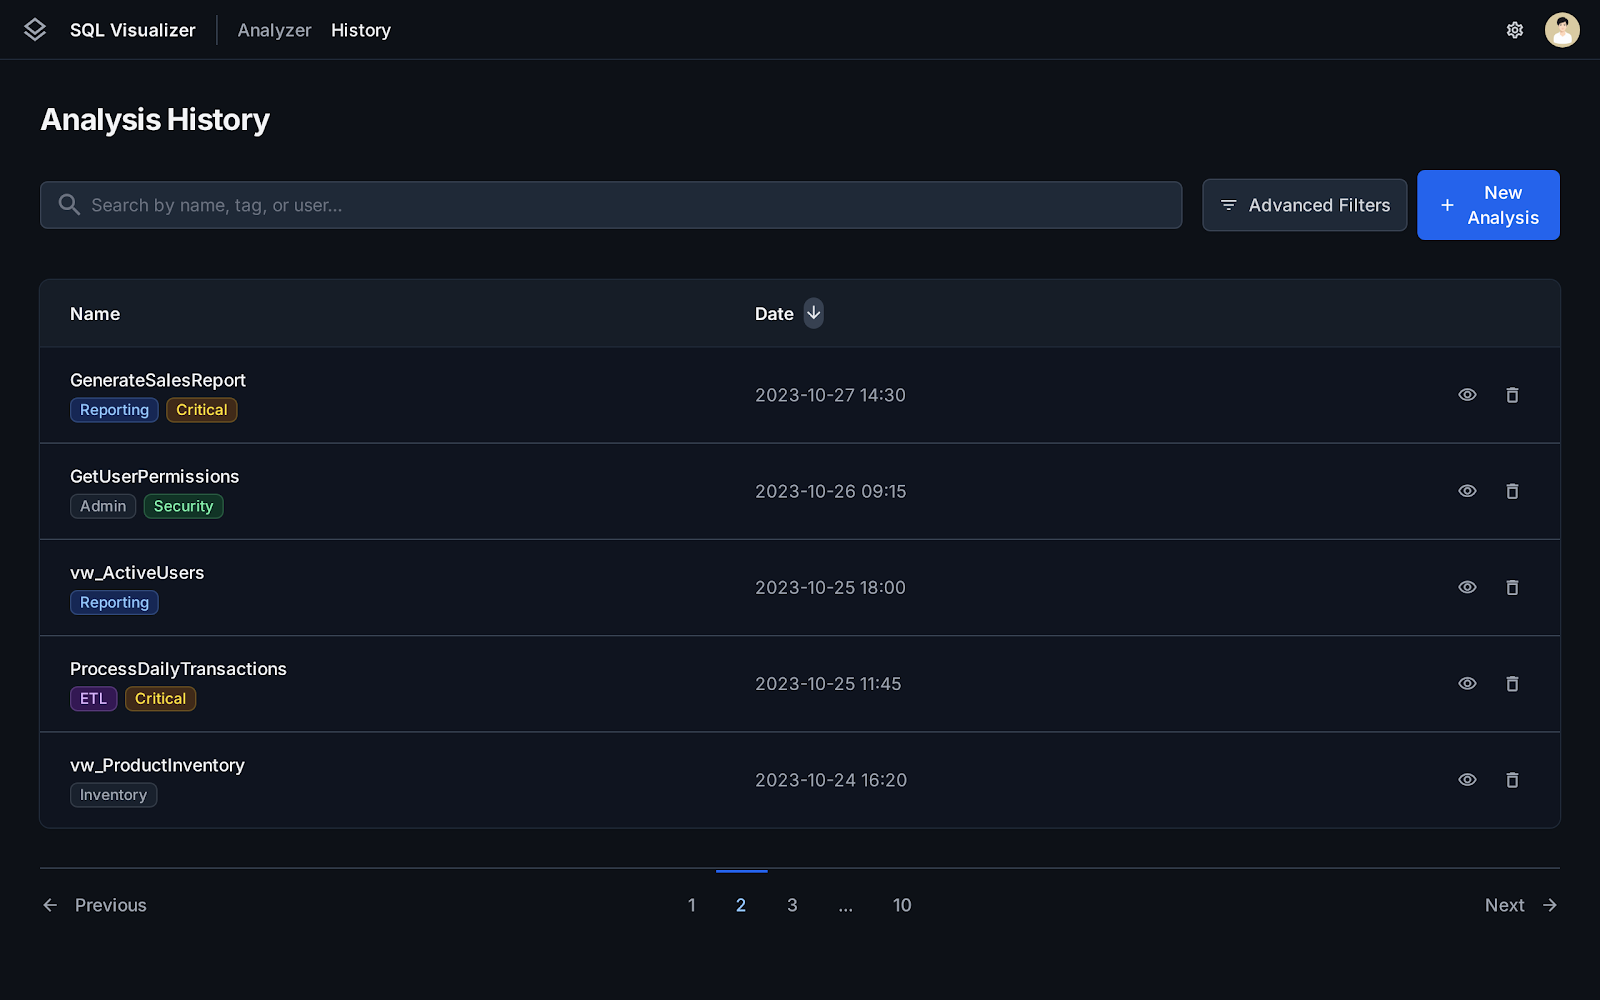
Saved Analysis History
Every analysis you run can be saved and organized into folders. Come back to any query at any time — no re-running needed.
Chat with your SQL code
Ask questions about your query in plain English. The built-in AI assistant understands your full SQL context — stored procedures, joins, parameters, and logic — so you can get answers without leaving the analysis.
- Ask what any section does in plain English
- Get performance suggestions and index recommendations
- Receive rewritten SQL snippets you can copy directly
What does this stored procedure do?
This stored procedure usp_GetOrderSummary retrieves a summary of customer orders within a given date range. Here's the breakdown:
@StartDate and @EndDate to filter the Orders table.Orders → Customers and Orders → OrderItems → Products to pull customer names and line-item details.TotalAmount and ItemCount per customer.Are there any performance concerns with the joins?
Yes — two things to watch:
OrderItems → Products scans the full Products table since there's no filter on it. Adding a covering index on Products(ProductID) including ProductName would help.GROUP BY on CustomerName (a string) is slower than grouping by CustomerID and joining the name after aggregation.-- Faster: group by ID, join name after
SELECT c.CustomerName, agg.TotalAmount
FROM (
SELECT CustomerID, SUM(Amount) AS TotalAmount
FROM Orders GROUP BY CustomerID
) agg
JOIN Customers c ON c.CustomerID = agg.CustomerID
-- Faster: group by ID, join name after
SELECT c.CustomerName, agg.TotalAmount
FROM (
  SELECT CustomerID, SUM(Amount) AS TotalAmount
  FROM Orders GROUP BY CustomerID
) agg
JOIN Customers c ON c.CustomerID = agg.CustomerIDReady to demystify your SQL?
Paste your first query above — no account required to try it.